
Subject: University Spending on Instruction
To: Chancellor Muñoz, CFO Schnier, and Executive Vice Chancellor and Provost Dumont
CC: Bianca Khanona, Laura Martin, Cori Lucero, Kevin Mitchell, Fatima Paul
BCC: All Deans, Department Chairs, Divisional Council Members, and School Executive Committee Chairs and Vice Chairs
Date: December 12, 2025
Executive Summary: UC Merced spends less on instruction compared to others in the UC System, spending only 18% of our annual expenses on instruction, compared to an average of 25% at other UCs, and about $12,000 per student compared to a median of about $26,000 at other UCs. Moreover, over time, we have decreased the percentage of our spending dedicated to instruction, with particularly clear drops in 2020 and 2023. To protect our academic mission, we urge the administration to seriously reconsider any further cuts to instruction.
Chancellor Muñoz, CFO Schnier, and EVC/VP Dumont,
Thank you for taking the time to answer questions from faculty in the meeting of the division. It is an opportunity most faculty seldom have and greatly appreciate.
As you may recall, Dr. Amussen and Dr. Flores asked questions regarding the campus’s financial investment in instruction, pointing out that UC Merced has the lowest levels in the UC system. Your response suggested that they may be mistaken, or not looking at a per-student cost, and Chancellor Muñoz requested more information.
We are, therefore, reaching out to you on behalf of our members to share our analysis of data from UCOP. These data show that, compared to other UC campuses, we spend comparably less on instruction, not only as a percentage of our budget, but as an absolute amount per student. As such, we hope you will restart the conversation about how to protect and advance the campus’s teaching mission through the current budget cuts.
Our data on expenditures comes from UCOP’s 2024-2025 financial report on all campuses. We have also provided all of the data in a spreadsheet here. UCOP divides the expenses for each campus into categories recommended by the National Association of College and University Business Officers’ (NACUBO), and you can find the UC definition of each expense type they use here.
In particular, we want to call your attention to pages 11 and 12, where each university’s expenses are listed. Each table has a top-line number called “Instruction.” The instruction line reports total expenditures on departments and instructional programs, which include faculty salaries and benefits and the TAS budget.
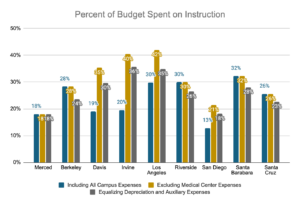
The figure below shows the percentage that each campus spends on instruction out of its total expenses. As the first (blue) bar shows, 18% of our expenses last year were on instruction. The cross-campus average is 25% (27% among campuses without medical centers). Our two closest competitors for undergraduates spent 30% (Riverside) and 26% (Santa Cruz) on instruction. Based only on these unadjusted numbers, we are the second lowest in the proportion of our expenses dedicated to instruction; only UC San Diego is lower (13%), primarily due to medical center costs.
Of course, as Dr. Schnier pointed out during the meeting, there are unique characteristics of our campus and its budget that might make our expense proportions different from other campuses.
First, we do not have any medical center expenses. We calculated the percentage spent on instruction without medical center expenses (Tab; gold bars). Our percentage does not change, but the overall average across all campuses jumps to 32% and we fall to a clear last place.
Second, we have the largest percentage of our expenses going to Auxiliary Enterprises (12%; the next nearest is Santa Cruz at 11%) and Depreciation & Amortization (15%; the next nearest is Riverside at 9%). Whether we remove those lines from the budget entirely (Tab), or force every other campus to dedicate 12% to Auxiliaries and 15% to Depreciation & Amortization, cutting expenses from all other categories proportionally (Tab; slate bars), we would remain notably behind in instructional spending.
In sum, even taking these unique characteristics into account, our expenditures on instruction are the lowest. While it’s impossible to make exact comparisons with other campuses, the data show that underspending on instruction cannot be blamed solely on these factors.
If Figure 1 does not load, you can access it here.
We also examined the amount of money spent on instruction relative to revenue from tuition and state educational appropriations. In 2024, UC Merced spent only 28% of that revenue on instruction ($99M; Tuition & Fees + State Educational Appropriation = $353M), whereas the average non-medical campus spent 57% of that total on instruction (tab). The next lowest campus to us was Santa Cruz at 50%.
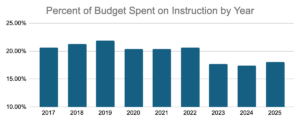
We also wanted to know if we had always dedicated such a comparatively small portion of our expenses to instruction. As such, we used the annual UCOP financial reports (which date back to 2016) to examine the percentage of expenses on instruction as a function of year. The graph below shows that the proportion of our expenses dedicated to instruction was growing until 2019, peaking at 22%—just 2% below the current UC average. Then, in 2020, it fell to 20%. Of course, there was the pandemic and the 2020 Project was completed that year, so a small decline in spending dedicated to instruction is perhaps not surprising. Still, in 2023, it suffered another relative cut, falling to its current level of 18%. This shows that, not only are we underinvested in instruction, we appear to have relatively divested over time.
If Figure 2 does not load, you can access it here.
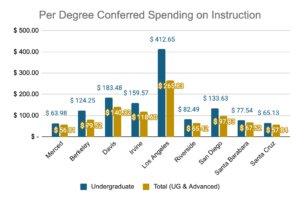
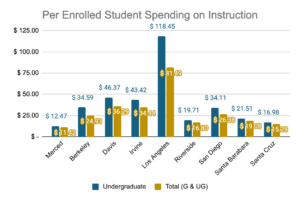
We recognize that relative budgets are complex and that our younger, smaller campus might have unique needs. As such, it is perhaps not entirely reasonable to simply compare percentages across campuses. Dr. Schnier argued on Thursday that it was more important to look at per-student expenses. So, we examined the per capita spending on instruction based on enrollment and number of degrees conferred (Tab 4).
As the chart below shows, UC Merced spends the lowest dollar amount in the system per student ($11,416) and per degree awarded ($56,813) on instruction. Compare that to the system-wide median of $25,653 per student ($17,939 on campuses without medical centers) and $88,678 per degree awarded ($66,417 on campuses without medical centers).
If Figure 3 does not load, you can access it here.
We find these data compelling and believe that they demonstrate that UC Merced has actively divested from instruction, showing a pattern of deprivation of the instructional budget relative to ourselves and other campuses. This is perhaps most surprising given that we pride ourselves on serving first-generation college students and students who thrive best with individualized instructional attention.
While data are always useful, they only confirm what faculty members have known and expressed in many meetings with you all and other campus leadership: In our day-to-day experiences, we are finding it harder and harder to do our jobs well as we deal with cuts to TA support, increasingly large classes, and withering graduate programs. The planned budget cuts will exacerbate these challenges past a reasonable point and further deprive our students of a quality education.
Although we recognize that the university is facing financial obstacles, we think that cuts should be strategic and protect our already under-resourced academic and research missions. We hope that these data explain the faculty’s questions about educational quality by showing how relatively under-resourced instruction on campus has become. The cuts to instruction for next year will only make this problem worse, and the availability of classes will undermine recruitment and retention efforts. The budget should be strategically adjusted to protect spending on instruction and, instead, find cuts in other areas.
Faculty have experiences, insights, and budgetary expertise that can benefit the campus during these difficult budgetary times. Now that you have seen the data, we invite you to restart the conversation begun last week.


Let’s also be clear that UC Merced has eliminated 25% of all lecturers in this time period while increasing the number of “professional staff” by 19 more then the lecturers fired. They’ve done this largely to the lectureship, which has been called by administrator after administrator as “fungible”. In doing so, this campus has single handedly set fire to two decades of collective bargaining, treating 8th, 9th, 10th, 11th year teachers like temp workers– fungible!
We’ve also worked methodically to eliminate lecturer voices within the university, starting with eliminating the entire committee structure and peer review process of the largest program of faculty, the Merritt Writing Program, and even going so far as to restrict lecturer communications.
This is happening to the teaching professionals who deliver the education this campus depends on to survive– creating trauma after trauma after trauma– while we are struggling to get and keep students. How can that be anything but self destructive?
Furthermore, this campus has taken directly from public funding while cutting teaching and, somehow paying for dramatically more professional staff. We now have something like 1 “manager” and “professional staff” for every 1.5 faculty, and using public funds to expand administration while gutting education funding.
Can someone do a workload assessment of the vast administrative footprint on this campus? What do administrators do all day with their time? What could possible justify the need for dramatically more “professional staff” while enrollment has been flat?
We’ve done this to the only HSI in the UC, and we’ve done this to the cheapest qualified faculty who represent the greatest concentration of diversity within the faculty.
This is because lecturers are not enfranchised within the faculty senate, and that lack of power has been so clearly exploited at this campus the last three years….
Fiat Lux to those behind this study! And eternal gratitude from the 25% of lecturers who this campus was so hasty to fire they violated the contract requirements on time of notifications. And zero effort to help anyone find a job on campus, or off.
We fired 8th year faculty in the middle of the school year….